

State of the Markets
Note: Why do we need to understand the state of the markets?
The state of the markets is like the “pitch” in a test match. The captain needs to read the pitch and then decide on the playing eleven. For example, if it is a turning wicket, you may wish to play an additional spinner. Similarly, based on the state of the market, you might wish to change your allocations or stock selection.
One of the ways in which market health can be measured objectively is by monitoring the market breadth. It is purely data-based, unbiased and objective. Like any other indicator, it needs to be evaluated in sync with many other factors and never in isolation. However, it is a good metric to keep track of. As of now market breadth is strong.
No of stocks hitting new 52-week highs has cooled down in the last few weeks but it continues to be still higher than no of stocks hitting new 52-week lows (Universe Nifty 500).
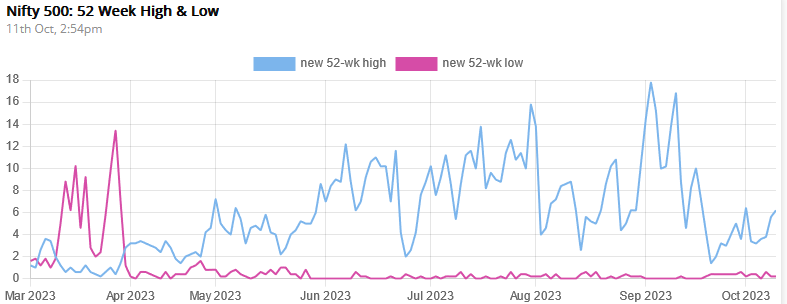
Therefore the net new 52 highs and lows are continuing to remain positive, though the intensity has considerably reduced after relentless strength for several months (Universe Nifty 500).

% of Nifty 500 stocks above key long-term moving averages remains elevated. There hasn’t been any slack in % of stocks above 200 day moving average. The % of stocks above 50 days moving average has deteriorated over the last few weeks suggesting the pullback and correction so many stocks have witnessed but a large % of stocks still remain in the strength zone overall and also displaying a sharp recovery as of today.

A brief history of quantitative investing
In this post, let us delve into the history of quantitative investing.
Early Beginnings:
The origins of quantitative investing can be traced to the 1960s when academics William Sharpe, Harry Markowitz and James Tobin, developed the Modern Portfolio Theory (MPT) which aimed to optimize the portfolio mix and maximize returns through diversification.
Emergence of Computer Technology:
The widespread availability of computer technology in the 1970s made it possible to apply mathematical modelling and statistics to financial analysis. One of the early examples was the Capital Asset Pricing Model (CAPM), which used quantitative analysis to determine the expected return on an asset. This paved the way for the productive implementation of MPT by investment managers.
Rise of Algorithms and Machine Learning:
In the 1980s and 1990s, Investment firms began to use more advanced statistical models and algorithms to identify patterns and trends in financial data. This approach gave rise to systematic quantitative strategies using computerized investing rules.
Quantitative investment and systematic investment strategies have evolved over time, and now some of the world’s most successful hedge funds and alternative asset managers use quantitative approaches to investing.
Intelsense Insights
The quant strategies have started displaying their magic with the markets perking up.

You can subscribe to our smallcases from: https://intelsense.smallcase.com/
Please note:
Quiver is available only on the smallcase platform
Q10 acts as a complementary strategy to the multi-cap diversified Q30 strategy. Q10 and Q30 are part of the quant bundle subscription via https://intelsense.in if you prefer DIY execution. So, if you want both Q10 and Q30 and are okay to do the execution and management yourself, the bundle works out cheaper.
DISCLAIMER:
Investments in the securities market are subject to market risks. Read all the related documents carefully before investing.
SEBI Registered Research Analyst - Registration Number: INH300006607
Registration granted by SEBI and certification from NISM in no way guarantee the performance of the intermediary or provide any assurance of returns to investors.